
How to go from “4% conversion uplift” to “€636K — €854K extra profit this year”. Example calculation sheet included!
I’ve created a method to calculate the impact of A/B testing in terms of yearly profit. And not unimportant: this has been accepted by the whole company. This method isn’t perfect, but it gives you as a CRO manager quite some power to prove the effect of your team.
The prerequisites to do this:
-
showing what you normally would expect to get in terms of traffic, number of orders and average revenue (or even average profit) per order for the next 12 months. If you don’t have this, you could take data of the past 12 months as an alternative baseline.
-
You ran some successful A/B test :).
* I take 12 months so I don’t have to worry about any seasonal effects.
Our BI/Finance team can already provide me with the baseline prediction (based on current numbers and including predictions on competitors, market changes, investments etc. etc.) so I don’t have to worry about that. Of course we also have some successful A/B tests at our disposal.
Now I can perform these steps:
-
Calculate the extra profit by just running this single A/B test.
-
Prediction/extrapolation: A) Increase the baseline 12 month prediction with the changes in conversion rate and/or average order value proven by the test.B) Make some corrections on A) to make sure you’re not overselling yourself.
1) Calculate the extra profit by just running this single A/B test
This is just a simple calculation only based on your A/B test data. You calculate the revenue (or better: profit) from your original variant and all other variants. Then you calculate the difference if you would have had the original running 100% versus running the test with all your variants.
This works for all tests (successful or not) and tells you if you made any loss/gain during the test itself. Of course you only implement the winner, but if you test multiple variants it could be that the net result during the testing period is negative. This helps you to get a grip on the monetary cost/risk of performing A/B test.
2A) Increase the baseline 12 month prediction
This one is actually quite simple: you take your prediction (we have it on a day-by-day basis) and apply the changes in conversion rate and average order value that we saw in the test.
2B) Make some corrections
Now this is where it gets tricky. 2A) will get you a very precise (and usually quite high) number which I feel will need some corrections (downwards) to make it realistic. I also prefer to put it in a range instead of just one single number.
Some of the assumptions/corrections I do:
-
I assume a diminishing effect per month. I’ve set this to 2% which means
that after a full year, you will only have 78% of the original effect
left. -
When I do a test in a single or just a couple of countries, I always assume
the effect will be less when applied in other countries. In the same
region I’ve set this to 25%, for countries outside the tested region
this is set to 50% (this is not included in the example sheet below). -
A correction for the significance level (we test at 95%). This correction
makes no sense when applied to one test, but when you do this for all
experiments that you implement, you can assume a certain part (around
23%,
After all corrections I turn the single number that comes out of this equation into the upper limit of a range and subtract a percentage to get to a lower limit. For a country this is 20%, when applied to the same region it’s 40% and for the rest of the group this is 50%. All arbitrary numbers.
And the result of all this? Instead of saying “we have improved conversion by 4%” I can now claim “after implementation this test gives us €636K — €854K extra profit this year”.
Try it yourself!
For obvious reasons I can’t share our own internal sheet (containing our complete budget), but I made a simplified version in Google Sheets that should make the basic calculations clear:
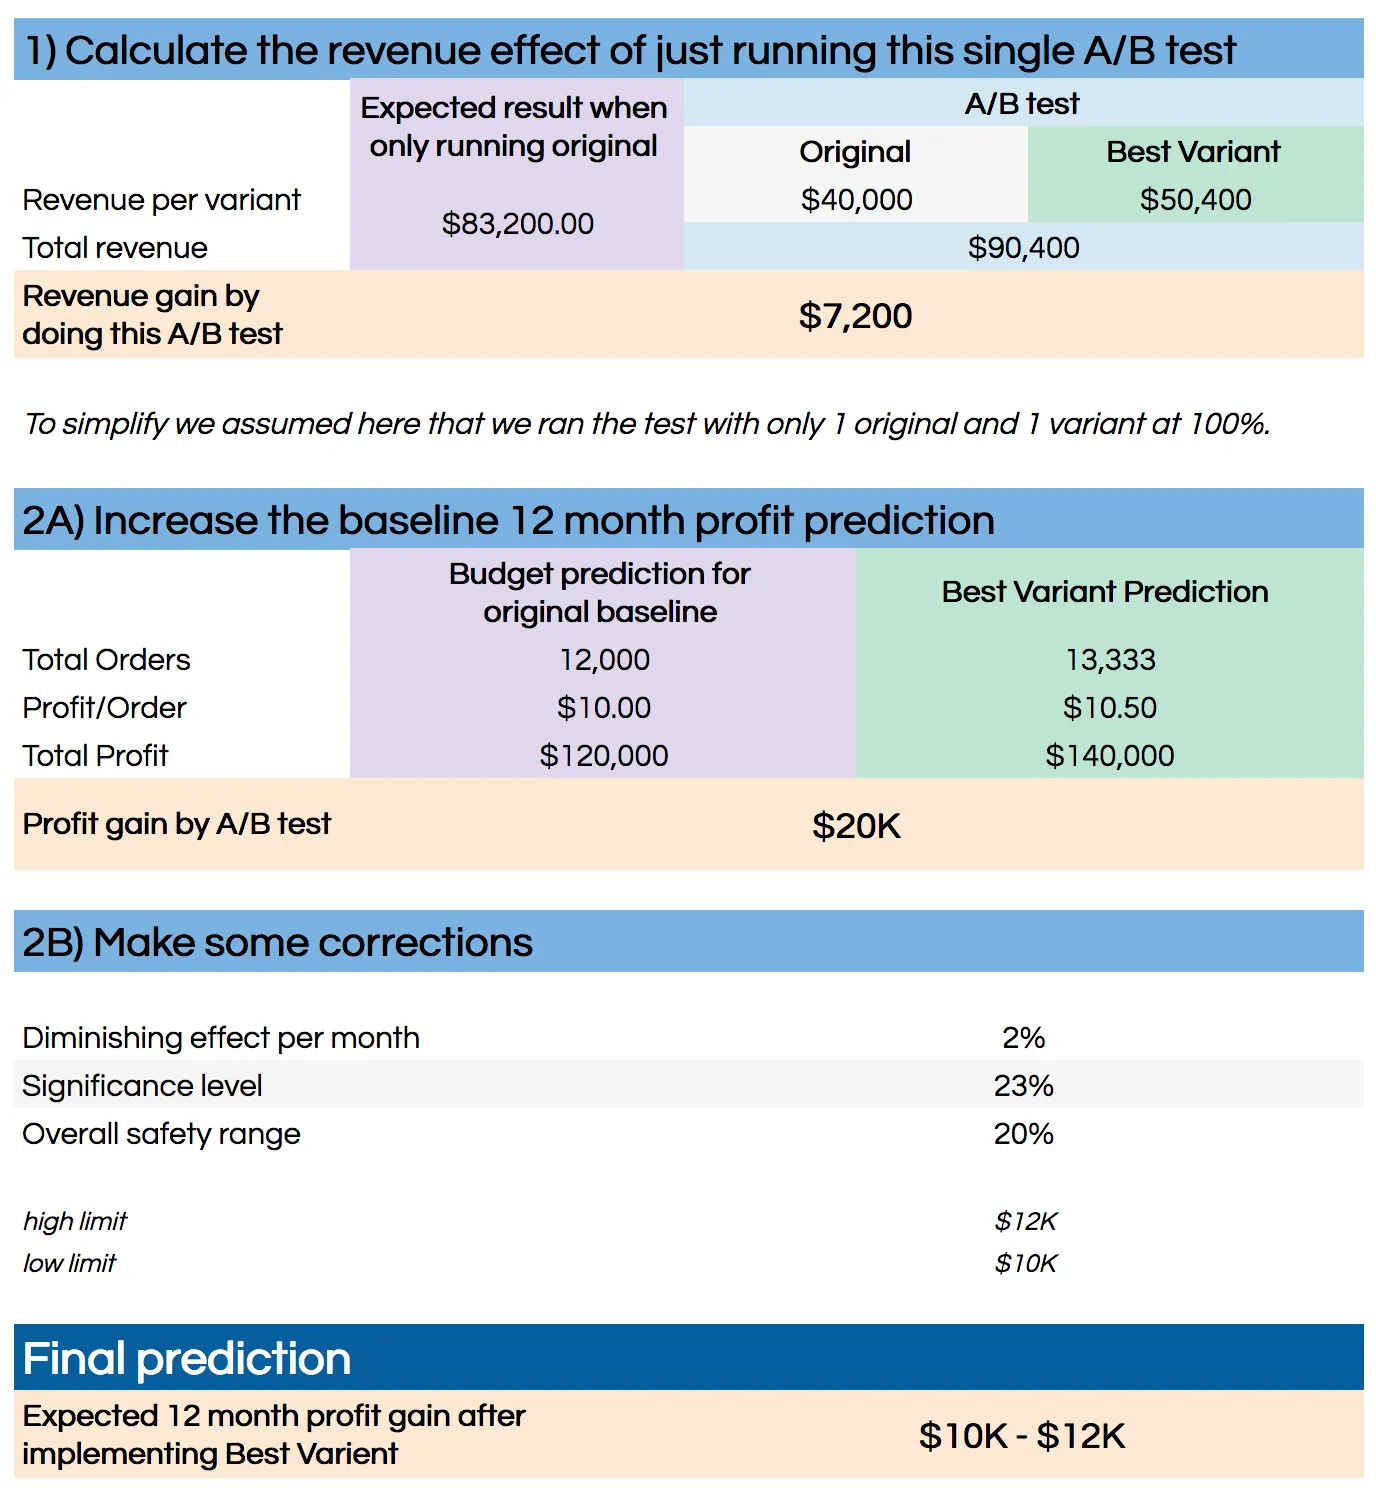
Example of the calculation sheet (the Google Spreadsheet is no longer available)
Let me know if you think some things are off or if you have any improvements.
Write down your assumptions
I highly recommend writing down all your assumptions in your calculation sheet. You will need to make quite some of them to make this work and writing it down makes it tangible and easier to adjust afterwards if you have more data to update your assumptions and the calculations based on them.
Some more written down assumptions I have in my sheet:
-
We
work across 12 countries with different currencies while the budget predictions are all int he same currency. Changes in exchange rates will not be taken into account. -
During A/B tests we optimize for CR and AOV but the testing system cannot optimize for profit (technical limitation). Profit is a percentage of AOV but this is different for different countries and different products. This calculation assumes a stable relation between AOV and profit which is the best we can do right now.
This also helps when sharing this sheet internally because: buy-in!
Don’t do this on your own, get buy-in
Now I didn’t build this sheet on my own: I also got our business analyst and our financial controller involved to check the numbers, the calculations and all assumptions. They helped improving the sheet to match how finance calculate numbers and to get an official stamp of approval.
Some final remarks
Of course this is just a prediction and even in hindsight after 12 months you will not be able to calculate if the changes in your numbers were a result of your A/B test implementation.
This fact means it still feels a bit weird to me to do such a prediction. But because we made this together with BI/Finance this is currently the best way we have to quantify the effect of our experiments. It also provide us with a way to compare our experiments.
But the best reason to do this is that it works really well. Putting a dollar sign in your experiment reports makes a lot more people interested in the results and helps you to increase your budget.